

بررسی خوشه بندی نقاط کلیدی الگوریتم sift
سپتامبر 27, 2020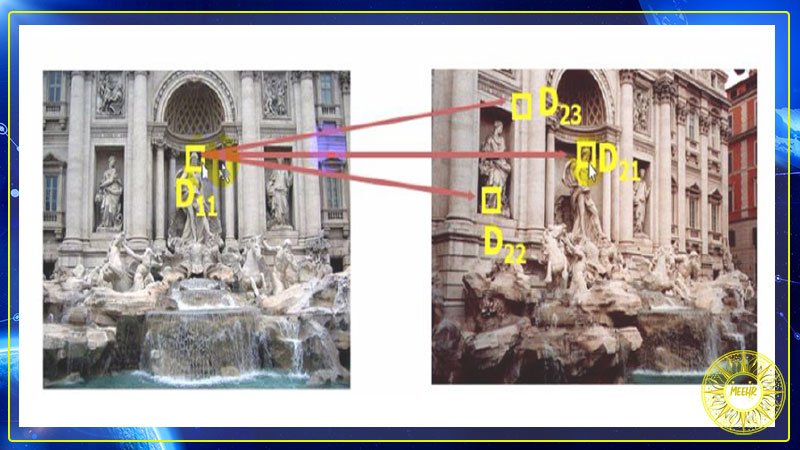
توضیح الگوریتم sift
اکتبر 4, 2020مقاله بازیابی بهبود یافته تصاویر پزشکی با استفاده الگوریتم خوشه بندی

Improved Retrieval of Medical Images Using K- means Clustering Algorithm
ABSTRACT
Due to the rapid and increasing progress of medical equipment and medical imaging machines, a large number of digital images are produced in therapeutic centers and stored in the large databases. Retrieving a set of images which are most similar to a query image is a major challenge in this field. A popular way to address this problems is to apply image retrieval based on a bag of visual words. A popular technique for producing visual words is to use K-means clustering algorithm. However, the effectiveness of K-means algorithm highly depends on the initial selection of cluster centroids which are selected randomly in the original K-means algorithm. Therefore, the image retrieval task is affected by poor clustering solutions due to random selection of cluster centroids. The goal of this paper is to overcome this problem and improving the accuracy of content based image retrieval from medical image databases using the optimal selection of initial points in K-means clustering algorithm. In the proposed method, after extracting SIFT features from the color images, the optimal centroid points are selected based on different ranges, weights and means of samples and visual words are created based on the selected centroid. The result of experiments on applying three different algorithms for selecting initial cluster centroids show that selecting the optimized initial points results in producing more discriminative visual words and provide favorable accuracy for medical image retrieval systems.
چکیده : با توجه به پیشرفت سریع و روزافزون تجهیزات پزشکی و دستگاه های تصویربرداری پزشکی ، تعداد زیادی تصویر دیجیتالی در مراکز درمانی تولید و در پایگاه های اطلاعاتی بزرگ ذخیره می شود. بازیابی مجموعه ای از تصاویر که بیشترین شباهت را به تصویر پرس و جو دارند ، یک چالش اساسی در این زمینه است. یک روش محبوب برای حل این مشکلات استفاده از بازیابی تصویر بر اساس یک کیف کلمات تصویری است. یک روش محبوب برای تولید کلمات تصویری استفاده از الگوریتم خوشه بندی K-means است. با این حال ، اثربخشی الگوریتم K-means بسیار به انتخاب اولیه مرکزهای خوشه بستگی دارد که به طور تصادفی در الگوریتم اصلی K-means انتخاب می شوند. بنابراین ، کار بازیابی تصویر تحت تأثیر راه حل های خوشه بندی ضعیف به دلیل انتخاب تصادفی مرکزهای خوشه , قرار می گیرد. هدف این مقاله غلبه بر این مشکل و بهبود دقت بازیابی تصویر مبتنی بر محتوا از پایگاه داده های تصویر پزشکی با استفاده از انتخاب بهینه نقاط اولیه در الگوریتم خوشه بندی K-means است. در روش پیشنهادی ، پس از استخراج ویژگی های SIFT از تصاویر رنگی ، نقاط مراکز بهینه براساس دامنه های مختلف ، وزن و معنی نمونه ها انتخاب می شوند و کلمات تصویری بر اساس مرکزها انتخاب شده ایجاد می شوند. نتیجه آزمایشات انجام شده با به کار گیری سه الگوریتم مختلف برای انتخاب مراکز اولیه خوشه نشان می دهد که با انتخاب نقاط اولیه بهینه شده ، کلمات تصویری افتراقی(تمایز) بیشتری تولید می شود و دقت مطلوبی برای سیستم های بازیابی تصویر پزشکی فراهم می کند.
INTRODUCTION
With the development of technology and prevalence of digital
images in the medical field, a large number of medical images is produced in
hospitals and medical research centers including X-ray, MRI, and CT scan. Image
retrieval has become one of the most active research area in the field of
computer vision especially in the applications that require browsing the large
multimedia repositories. In the past decade, content-based medical image
retrieval have had a huge impact on the diagnosis and treatment of diseases….
Content-based image retrieval (CBIR) is the application of computer vision techniques to search for images that have the most visual similarity to a query image in a large database. The interest in CBIR has grown because of its large range of possible applications for efficient image retrieval. It made CBIR a prosperous field of study in the past few years. The main objective of the content-based image retrieval is extracting low level features for grasping semantic similarity to find those images which have the most similarity in visual content. Nowadays, the bag-of-features (BOF) is a common method of interest in the large-scale image retrieval systems which is an extension of bag-of-words in text mining [2]. It has proved to be an efficient method in both image retrieval and classification. In BOF model each image is described as a collection of local features. The BOF model has four main phases that must be taken into consideration:
1 ) feature extraction
2 ) constructing the visual words which is the phase required to create a visual dictionary by using the clustering algorithms and defining the cluster centers as visual words
3) assigning the collected feature examples to the clusters by calculating the similarity between the examples extracted from a given image and the visual word defined in the previous step
4) retrieving and classifying the query image on the basis of a histogram matching technique [1]. In the most of the recent studies, the K-means clustering algorithm is commonly used as a major component to create the visual words, i.e. the cluster centers [1]
The K-means algorithm proceeds by alternating between the two steps: In the first step, k data points are randomly selected as initial cluster centers. Then, the remaining tuples in the dataset are allocated to the clusters based on their (Euclidean) distance to the cluster centers. In the second step, after allocating the tuples to the cluster centroids, a new center is calculated for each cluster are by averaging the vectors of tuples included in the cluster. It continues until no data point is changed.
However, the K-means algorithm is significantly sensitive to the selection of cluster centers. Since the initial centers are selected randomly, the K-means algorithm does not necessarily find the optimal clusters. Therefore, the visual words does not have sufficient accuracy to describe the image features which affects the performance of the retrieval algorithm. In addition, various performances results is achieved for the same input data [4]-[5]. In this paper, to gain optimal visual words, three methods have been involved for selecting the optimal initial cluster centers providing more accurate retrieval of the medical images
The rest of this paper is organized as follows: In the second section, related works are presented. In the third section, the proposed method to retrieve medical images by using optimal visual words are expressed. The experimental results and their discussion are shown in section four and section five provides conclusions and future works.
معرفی : با پیشرفت فناوری و شیوع تصاویر دیجیتال در حوزه پزشکی ، تعداد زیادی تصاویر پزشکی در بیمارستان ها و مراکز تحقیقات پزشکی از جمله اشعه ایکس ، ام آر آی و سی تی اسکن تولید می شود. بازیابی تصویر به یکی از فعال ترین حوزه های تحقیقاتی در زمینه بینایی ماشین به ویژه در برنامه هایی که نیاز به مرور مخازن بزرگ مالتی مدیا دارند تبدیل شده است. در دهه گذشته ، بازیابی تصویر پزشکی مبتنی بر محتوا تأثیر بسزایی در تشخیص و درمان بیماری ها داشته است.
بازیابی تصویر مبتنی بر محتوا (CBIR) استفاده از تکنیک های بینایی ماشین برای جستجوی تصاویری است که بیشترین شباهت بصری را با یک تصویر جستجو در یک پایگاه داده بزرگ دارند. علاقه به CBIR به دلیل طیف وسیعی از برنامه های کاربردی ممکن برای بازیابی کارآمد تصویر افزایش یافته است. این امر CBIR را در چند سال گذشته به یک زمینه موفق مطالعاتی تبدیل کرد. هدف اصلی بازیابی تصویر مبتنی بر محتوا استخراج ویژگی های سطح پایین برای درک شباهت معنایی برای یافتن آن تصاویر است که بیشترین شباهت را در محتوای تصویری دارند. امروزه ، کیف ویژگی ها (BOF) یک روش معمول مورد توجه در سیستم های بازیابی تصویر در مقیاس بزرگ است که گسترش روش کیف کلمات در استخراج متن است [2]. ثابت شده که این روش هم در بازیابی تصویر و هم در طبقه بندی یک روش کارآمد است. در مدل BOF هر تصویر به عنوان مجموعه ای از ویژگی های محلی توصیف شده است. مدل BOF دارای چهار مرحله اصلی است که باید مورد توجه قرار گیرد:
- 1) استخراج ویژگی
- 2) ساخت کلمات بصری که فاز مورد نیاز برای ایجاد فرهنگ لغت بصری با استفاده از الگوریتم های خوشه بندی و تعریف مراکز خوشه به عنوان کلمات تصویری است
- 3) اختصاص دادن نمونه های ویژگی جمع آوری شده به خوشه ها با محاسبه شباهت بین نمونه های استخراج شده از یک تصویر داده شده و کلمه تصویری تعریف شده در مرحله قبل
- 4) بازیابی و طبقه بندی تصویر پرس و جو بر اساس یک روش تطبیق هیستوگرام در بیشتر مطالعات اخیر ، الگوریتم خوشه بندی K-means معمولاً به عنوان یک جز اصلی برای ایجاد کلمات تصویری ، یعنی مراکز خوشه مورد استفاده قرار می گیرد
الگوریتم K-mean با تناوب بین دو مرحله پیش می رود: در مرحله اول ، k نقاط داده به طور تصادفی به عنوان مراکز اولیه خوشه ها انتخاب می شوند. سپس ، تاپل های باقیمانده در مجموعه داده بر اساس فاصله (اقلیدسی) آنها از مراکز خوشه به خوشه ها اختصاص می یابد. در مرحله دوم ، پس از اختصاص تاپل ها به مراکز خوشه ، یک مرکز جدید برای هر خوشه با میانگین بردارهای تاپل موجود در خوشه محاسبه می شود. این کار تا جایی ادامه دارد که هیچ نقطه داده ای تغییر نکند.
اگرچه ، الگوریتم K-means به طور قابل توجهی به انتخاب مراکز خوشه حساس است اما از آنجا که مراکز اولیه به طور تصادفی انتخاب می شوند ، الگوریتم K-means لزوما خوشه های بهینه را پیدا نمی کند. بنابراین ، کلمات تصویری دقت کافی برای توصیف ویژگی های تصویر را که بر عملکرد الگوریتم بازیابی تأثیر می گذارد ، ندارند. علاوه بر این ، نتایج مختلف عملکرد برای داده های ورودی یکسان حاصل می شود [4] – [5]. در این مقاله ، برای دستیابی به کلمات بصری بهینه ، سه روش برای انتخاب مراکز اولیه بهینه خوشه فراهم شده است که بازیابی دقیق تری از تصاویر پزشکی را فراهم می کند
بقیه این مقاله به شرح زیر است: در بخش دوم ، آثار مرتبط ارائه شده است. در بخش سوم ، روش پیشنهادی برای بازیابی تصاویر پزشکی با استفاده از کلمات بصری بهینه بیان شده است. نتایج تجربی و بحث در مورد آنها در بخش چهار نشان داده شده است و بخش پنج نتیجه گیری و کارهای آینده را ارائه می دهد.
RELATED WORKS
Content-based image retrieval system (CBIR) has been raised for the first time in 1992, when Kato used it for automatically retrieving from a database of images based on color and shape [13]. Since then, the term has been used to describe the process of retrieving desired images from a large collection of images based on image features. However, recently, content-based image retrieval systems are widely used in applications such as digital library, facial recognition and fingerprints, online shopping, trademark search, and online search. But a small number of these systems have been designed and implemented in certain medical applications.
Caicedo et al. (2010) designed a recovery system based on multiple features that combine the features of the tissue and the SIFT, DCM descriptors used for histogram features. The SVM classifier has been employed to recover the image from the likely proximity of the input image to the appropriate category. They found that their test results in SIFT is less efficient than DCT in classification [6]. In 2011, Wang et al. provided a method of retrieving medical images based on the BOF method in which each image is represented by a set of local features such as split image and important point using SIFT descriptor. They employed multiple assignment of a local descriptor which make neighboring visual words by using K-means clustering and simultaneously assign weights to visual words to increase the performance and accuracy of the classification. Finally, in order to extract the similarities and to measure the distance, sub histogram similarity and the sub distance between visual words are used [1].
In 2013, Ravindran and shakila presented a CBIR method in which visual content of images was represented by bag of words (BOF). In their study, two main tasks were used to explore the visual features: 1) finding the correlation between visual patterns and high-level concepts that means finding the lowest redundancy and choose the most relevant features and clustering analysis 2) performing automatic annotation image. This method was tested on histology images and the accuracy of the method has been about 80% [7].
In 2014, Vanegas et al. employed the combination of unsupervised learning feature (ULF) and the classic descriptors such as SURF, SIFT, DCT. They used UFL to learn global features like color, scale and rotate automatically. Their test results showed excellent performance not only for recovery features but also for the performance which surpassed the standard descriptors [8]
Abdonazeer and Kumar [10] calculated the difference between the maximum and minimum value for each column of the data set. After defining numerical range of each column, the highest and maximum range is identified among the columns and the tuples are sorted based on selected column in ascending order. The data is divided into k equal parts and the average of each part is considered as initial centers of clusters.
S. Mahmud et al. [14] presented a technique that calculates the average value for each point by multiplying each component to a given weight. Then, it sorts the data according to average score and divides it into k sub-sets and calculates their average. The data point that is closer to the average value is considered as an initial cluster centers. Ran Vijay et al, [3] presented a method for selecting the initial centroids on a given frequency. In their approach, each attribute of the dataset is assigned a minimum and maximum value and its range is calculated by (1). Then, it divides the data points into k groups with wide range and calculates the frequency for data points on each group. The initial cluster centers are selected by identifying the high frequency data points.
Goyal and Kumar [2] provided a method for selecting the initial centers which is based on the distance from the origin. In their method the distance of all data points, i.e. Euclidean distance, are calculated from the origin, zero point, and then the data is sorted according to this distance. Then sorted data are divided into k categories and their averages are considered as initial centers.
In comparison with basis K-means clustering, Kumar Abdolnzeer and kumar method perform better in complexity and accuracy of their method which is suited for low values of k. In their method, choosing a large number for k, e.g. more than 10, results in producing empty clusters.
Sohrab’s method reduces the number of repetitions in K-means algorithm which decreases the computational complexity [14]. Their experiments showed that, by increasing the value of k, the accuracy of their method is decreased. Ran Vijay and colleagues [3] suggested an efficient method using K-means algorithm with randomly selected centers. But, the main drawback of their method is that by increasing the number of dimensions, the computational complexity and time are increased exponentially (k * k * d). They found that appropriate results can be achieved in when k <= 10. Kumar and Goyal method for random selection enjoys high efficiency but it remains challenging when k is large enough that has negative effect on robustness.
In the previous works discussed above, the K-means algorithm has been used to construct bags of visual words without addressing the problem of random selection of initial cluster centers. In our study, we propose to determine the optimal initial centers of clusters in the first step of K-means clustering algorithm and investigate its effects on the performance of the retrieval algorithm.
کارهای مرتبط
سیستم بازیابی تصویر مبتنی بر محتوا (CBIR) برای اولین بار در سال 1992 مطرح شد ، زمانی که کاتو از آن برای بازیابی خودکار از پایگاه داده تصاویر بر اساس رنگ و شکل استفاده کرد [13]. از آن زمان ، این اصطلاح برای توصیف روند بازیابی تصاویر مورد نظر از یک مجموعه بزرگ از تصاویر بر اساس ویژگی های تصویر استفاده می شود. با این حال ، اخیراً ، سیستم های بازیابی تصویر مبتنی بر محتوا به طور گسترده ای در برنامه هایی مانند کتابخانه دیجیتال ، تشخیص چهره و اثر انگشت ، خرید آنلاین ، جستجوی علائم تجاری و جستجوی آنلاین مورد استفاده قرار می گیرند. اما تعداد کمی از این سیستم ها در کاربردهای خاص پزشکی طراحی و پیاده سازی شده اند…
کایسدو و همکاران (2010) یک سیستم بازیابی بر اساس چندین ویژگی که ویژگی های بافت و توصیفگرهای SIFT ، DCM را برای ویژگی های هیستوگرام استفاده می کند ، طراحی کرد. طبقه بندی SVM برای بازیابی تصویر از مجاورت احتمالی تصویر ورودی با دسته مناسب استفاده شده است. آنها دریافتند که نتایج آزمایشات آنها در SIFT کمتر از DCT در طبقه بندی کارآمد است [6]. در سال 2011 ، وانگ و همکاران روشی را برای بازیابی تصاویر پزشکی مبتنی بر روش BOF ارائه داد که در آن هر تصویر با مجموعه ای از ویژگی های محلی مانند تصویر تقسیم شده و نقطه کلیدی با استفاده از توصیفگر SIFT نشان داده می شود. آنها از چندین توصیف گر محلی استفاده کرده اند که با استفاده از خوشه بندی K-means کلمات بصری همسایه می سازند و به طور همزمان وزن هایی را برای افزایش عملکرد و دقت طبقه بندی به کلمات بصری اختصاص می دهند. سرانجام ، برای استخراج شباهت ها و اندازه گیری فاصله ، از شباهت زیر هیستوگرام و زیر فاصله بین کلمات تصویری استفاده می شود [1]…
در سال 2013 ، راویندران و شکیلا روش CBIR ارائه دادند که در آن محتوای بصری تصاویر با کلمات کلیدی (BOF) نشان داده می شد. در مطالعه آنها ، از دو وظیفه اصلی برای کشف ویژگی های بصری استفاده شده است: 1) یافتن ارتباط بین الگوهای بصری و مفاهیم سطح بالا که به معنای یافتن کمترین افزونگی و انتخاب مناسب ترین ویژگی ها و تجزیه و تحلیل خوشه ای است 2) انجام حاشیه نویسی تصویر به صورت خودکار. این روش بر روی تصاویر بافت شناسی آزمایش شده و دقت روش حدود 80٪ بوده است [7]
در سال 2014 ، وانگاس و همکاران ترکیبی از یادگیری بدون نظارت ویژگی (ULF) و توصیف کنندگان کلاسیک مانند SURF ، SIFT ، DCT را به کار گرفت. آنها از ULF برای یادگیری ویژگیهای کلی مانند رنگ ، مقیاس و چرخش خودکار استفاده کردند. نتایج آزمون آنها عملکرد عالی نه تنها برای بازیابی ویژگی بلکه برای عملکردی که از توصیفگرهای استاندارد فراتر رفته است نیز نشان داد [8].
عبدونازیر و کومار [10] تفاوت بین حداکثر و حداقل مقدار را برای هر ستون از مجموعه داده ها محاسبه کردند. پس از تعریف محدوده عددی هر ستون ، بالاترین و حداکثر دامنه در میان ستون ها مشخص شده و تاپل ها بر اساس ستون انتخاب شده به ترتیب صعودی مرتب می شوند. داده ها به k قسمت مساوی تقسیم می شوند و میانگین هر قسمت به عنوان مراکز اولیه خوشه در نظر گرفته می شود
S. محمود و همکاران [14] تکنیکی را ارائه داد که مقدار متوسط هر نقطه را با ضرب هر مولفه در وزن معین محاسبه می کند. سپس ، داده ها را بر اساس میانگین امتیاز مرتب می کند و آنها را به k زیر مجموعه تقسیم می کند و میانگین آنها را محاسبه می کند. نقطه داده ای که به مقدار متوسط نزدیکتر باشد به عنوان مراکز خوشه ای اولیه در نظر گرفته می شود. Ran Vijay و همکاران ، [3] روشی را برای انتخاب مراکز اولیه در یک فرکانس(تکرار) مشخص ارائه دادند. در رویکرد آنها ، به هر صفت مجموعه داده حداقل و حداکثر مقدار اختصاص داده می شود و دامنه آن با رابطه زیر محاسبه می شود. سپس ، نقاط داده را به k گروه با دامنه وسیع تقسیم می کند و فرکانس را برای نقاط داده در هر گروه محاسبه می کند. مراکز خوشه ای اولیه با شناسایی نقاط داده فرکانس بالا انتخاب می شوند
( MAX+MIN )/K
Goyal و Kumar [2] روشی را برای انتخاب مراکز اولیه ارائه دادند که بر اساس فاصله از مبدا است. در روش آنها فاصله همه نقاط داده ، یعنی فاصله اقلیدسی ، از مبدا ، (نقطه صفر) محاسبه می شود و سپس داده ها با توجه به این فاصله مرتب می شوند. سپس داده های مرتب شده به k دسته تقسیم می شوند و میانگین آنها به عنوان مراکز اولیه در نظر گرفته می شوند.
در مقایسه با خوشه بندی مبتنی بر k-mean ، روش Kumar Abdolnzeer و kumar در پیچیدگی و دقت روش خود که برای مقادیر کم k مناسب است ، عملکرد بهتری دارند. در روش آنها ، انتخاب تعداد زیادی برای k ، به عنوان مثال بیش از 10 ، منجر به تولید خوشه های خالی می شود.
روش سهراب تعداد تکرارها را در الگوریتم K-means کاهش می دهد که پیچیدگی محاسباتی را کاهش می دهد [14]. آزمایشات آنها نشان داد که با افزایش مقدار k ، دقت روش آنها کاهش می یابد. ران ویجی و همکارانش [3] روشی کارآمد را با استفاده از الگوریتم K-means با مراکز انتخاب شده به طور تصادفی پیشنهاد کردند. اما اشکال اصلی روش آنها این است که با افزایش تعداد ابعاد ، پیچیدگی و زمان محاسباتی به طور نمایی افزایش می یابد (k * k * d). آنها دریافتند كه می توان در مواردی كه k <= 10 به نتایج مناسب دست یافت ، روش Kumar و Goyal برای انتخاب تصادفی از كارآیی بالایی برخوردار است اما وقتی k به اندازه كافی بزرگ باشد و تأثیر منفی بر مقاومت داشته باشد ، همچنان چالش برانگیز خواهد بود.
در کارهای قبلی که در بالا بحث شد ، از الگوریتم K-means برای ساختن کلمات تصویری بدون پرداختن به مسئله انتخاب تصادفی مراکز خوشه ای اولیه استفاده شده است. در مطالعه ما ، ما پیشنهاد می کنیم مراکز اولیه بهینه خوشه ها را در اولین مرحله الگوریتم خوشه بندی K-means تعیین کرده و تأثیرات آن را بر عملکرد الگوریتم بازیابی بررسی کنیم.
THE PROPOSED APPROACH
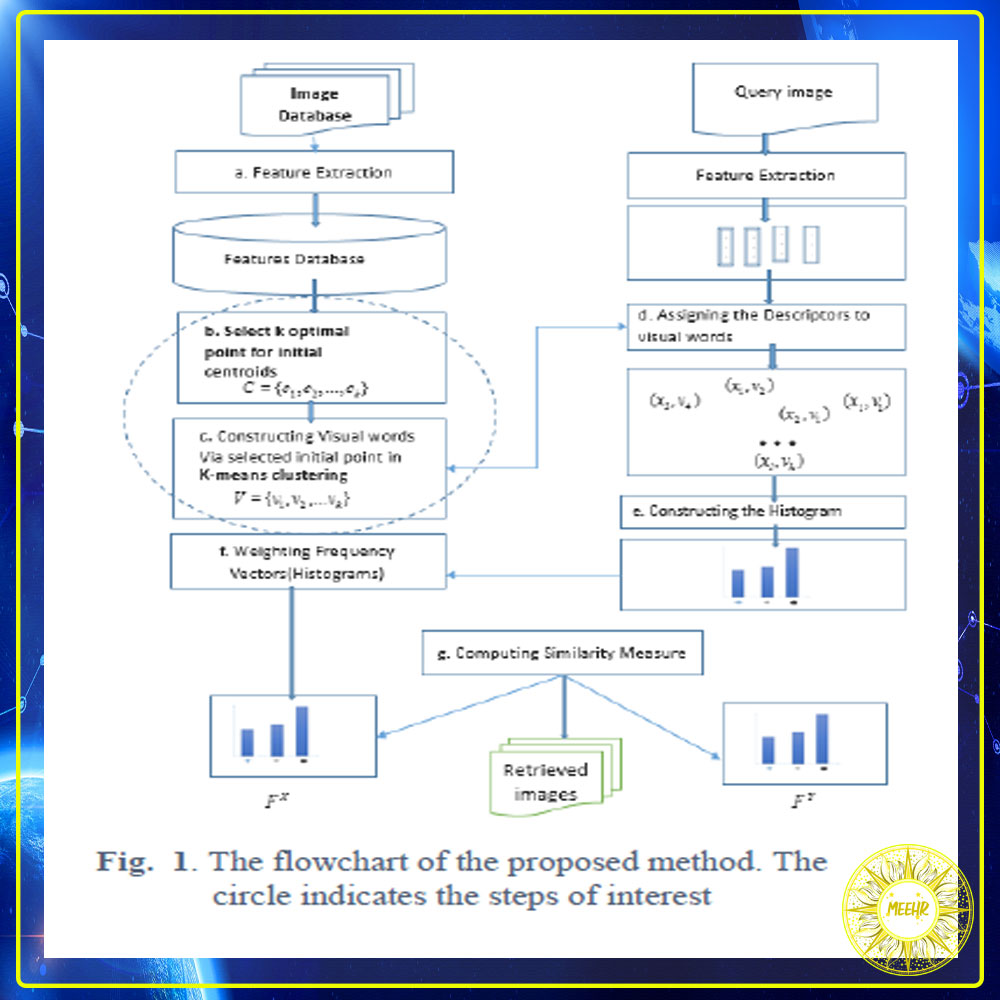
In this section, we introduce the proposed method in more detail. The flowchart presented in fig. 1 shows the overall procedure and its main stages which are described in the following sections…..
Feature Extraction: Our method provides extracting features which considers the input image as a series of small patches. Then, local features or interesting points from the patches are extracted using SIFT descriptor suggested in [10]…..
Claculating the visual words: The next step is creating the visual words by using K-means clustering method. The visual words refer to the feature vectors calculated as the representative of a cluster. In order to perform a deterministic selection of initial centroids,In our study, three main approaches are applied to select the initial centroids. The inputs of the algorithms include k which is a constant value as the number of centers and a n by m matrix D where n denotes the number of rows or data points that are indicated by (d1, d2, d3, …, dn) and m refers to the number of columns or features that are denoted by (x1 , x2 , x3 , …, xm)…..
The first approach is based on Nazeer et al, methods [10] that consists of five steps. Firstly, the maximum and minimum of data points are defined for each column and the difference between the maximum and the minimum is calculated for each column. Then, the column that has the highest range will be detected. Next, the set of data points for selected column are sorted, as non-additive. In the fourth step, the sorted set of data points are divided into k classes where k is the number of clusters. Finally, the average weight of each class of data points calculated separately and the obtained averages are considered as initial centers indicated by (c1, c2, c3… ck)….
The second approach follows the Goyal’s method [11]. At the first step, the distance from the origin, zero point is origin, is calculated for each data point in the set of data points D. In the second step, the distance that obtained in the previous stage sorted and according to the sorted distance, data set D can be arranged. The sorted collection of data points are divided into k classes, k is the number of clusters, in the third step. At the fourth step, the average of each category is obtained which considered as an initial centers….third approach employed a strategy called weighted score that adopted from the method suggested by Mostafazir et al. [12]. The procedure of obtaining initial of stages is described below:…
In the first step, the maximum value of each column is found, then for each row, the value of each attribute is divided by the maximum value and the resulting values are added together. The result is considered as the score of weight of this rows. The weight is calculated by:….
Where xj is the value of column j in the current row, 𝑥𝑗(𝑚𝑎𝑥) is the maximum value of column j and m is the number of columns in the dataset. In the second step, all of the data points are sorted in ascending order according to their weight values calculated in the first step. In the third step, the sorted data is divided into equal k groups, where k is the number of clusters. In the next step the average weight of the data points in each group is calculated separately. Finally, the data point that has closer weight to the average that calculated in the previous step is found and considered as the optimal cluster centers….
The most important challenge in these approaches is that, by increasing the value of k, the number of the empty clusters will be increased. In order to address this problem, the nearest point to the average of the data is considered as initial centers. After optimal selection of initial centers, the centers are considered as visual words
رویکرد پیشنهادی در این بخش ، روش پیشنهادی را با جزئیات بیشتری معرفی می کنیم. نمودار جریان ارائه شده در شکل 1 روش کلی و مراحل اصلی آن را نشان می دهد که در بخشهای بعدی شرح داده شده است.
استخراج ویژگی
روش ما استخراج ویژگی هایی را فراهم می کند که تصویر ورودی را به عنوان یک سری از پچ های کوچک در نظر می گیرد. سپس ، ویژگی های محلی یا نقاط مورد علاقه از پچ ها با استفاده از توصیفگر SIFT پیشنهاد شده در [10] استخراج می شوند.
بیان کلمات تصویری
مرحله بعدی ایجاد کلمات تصویری با استفاده از روش خوشه بندی K-means است. کلمات تصویری به بردارهای ویژگی محاسبه شده به عنوان نماینده یک خوشه اشاره دارند. به منظور انجام یک انتخاب قطعی از مراکز اولیه ، در مطالعه ما ، سه روش اصلی برای انتخاب مراکز اولیه استفاده می شود. ورودی های الگوریتم ها شامل k است که یک مقدار ثابت به عنوان تعداد مراکز و یک ماتریسD با ابعاد n※m است که در آن n نشان دهنده تعداد سطرها یا نقاط داده است که با (d1 ، d2 ، d3 ، … ، dn) نشان داده می شوند و m به تعداد ستون ها یا ویژگی هایی اشاره دارد که با (x1 ، x2 ، x3 ، … ، xm) مشخص می شوند.
اولین رویکرد مبتنی بر نازیر و همکاران است ، روشهایی [10] که شامل پنج مرحله است. در مرحله اول ، حداکثر و حداقل نقاط داده برای هر ستون تعریف می شود و تفاوت بین حداکثر و حداقل برای هر ستون محاسبه می شود. سپس ، ستونی که بیشترین دامنه را داشته باشد ، شناسایی می شود. بعد ، مجموعه ای از نقاط داده برای ستون انتخاب شده ، به عنوان غیر افزودنی ذخیره می شوند. در مرحله چهارم ، مجموعه مرتب شده از نقاط داده به k کلاس تقسیم می شوند که k تعداد خوشه ها است. سرانجام ، میانگین وزن هر کلاس از نقاط داده به طور جداگانه محاسبه شده و میانگین های بدست آمده به عنوان مراکز اولیه با (c1 ، c2 ، c3 … ck) در نظر گرفته می شوند.
رویکرد دوم از روش Goyal پیروی می کند [11]. در مرحله اول ، فاصله از مبدا ، (نقطه صفر مبدا است )، برای هر نقطه داده در مجموعه نقاط داده D محاسبه می شود. در مرحله دوم ، فاصله ای که در مرحله قبلی به دست آمده مرتب می شود و با توجه به فاصله مرتب شده ، مجموعه نقاط داده D را می توان مرتب کرد. مجموعه مرتب شده از داده ها در مرحله سوم به k کلاس تقسیم می شود ، k تعداد خوشه ها است. در مرحله چهارم ، میانگین هر دسته که به عنوان مراکز اولیه در نظر گرفته می شود ، بدست می آید.
رویکرد سوم از استراتژی ای به نام نمره وزن دار استفاده می کند که از روشی که مصطفازیر و همکاران پیشنهاد کرده اند استفاده می شود. [12] روش بدست آوردن مراحل اولیه در زیر شرح داده شده است:
در مرحله اول ، حداکثر مقدار هر ستون پیدا می شود ، سپس برای هر سطر ، مقدار هر ویژگی به حداکثر مقدار تقسیم می شود و مقادیر حاصل با هم جمع می شوند. نتیجه به عنوان امتیاز وزن این ردیف ها در نظر گرفته می شود. وزن توسط:
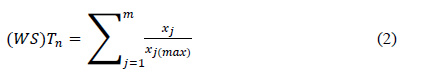
جایی که xj مقدار ستون j در ردیف فعلی است ، 𝑥𝑗 (𝑚𝑎𝑥) حداکثر مقدار ستون j و m تعداد ستونها در مجموعه داده است . در مرحله دوم ، کلیه نقاط داده با توجه به مقادیر وزنی محاسبه شده در مرحله اول ، به ترتیب صعودی مرتب می شوند. در مرحله سوم ، داده های مرتب شده به k گروه برابر تقسیم می شوند ، جایی که k تعداد خوشه ها است. در مرحله بعدی میانگین وزن نقاط داده در هر گروه جداگانه محاسبه می شود. سرانجام ، نقطه داده ای که دارای وزن نزدیکتر به میانگین محاسبه شده در مرحله قبل است ، پیدا شده و به عنوان مراکز خوشه بهینه در نظر گرفته می شود.
مهمترین چالش در این روشها این است که ، با افزایش مقدار k ، تعداد خوشه های خالی افزایش می یابد. برای رفع این مشکل ، نزدیکترین نقطه به میانگین داده ها به عنوان مراکز اولیه در نظر گرفته می شود. پس از انتخاب بهینه مراکز اولیه ، مراکز به عنوان کلمات تصویری در نظر گرفته می شوند
Assigning features to visual words
In this section we explain how features are assigned to visual words. Let 𝑥𝑙 denotes a feature vector that is assigned to the nearest word in the dictionary Vk. So the image X is represented by the local features {(xl, al)}. The al is calculated as follows…Where D (vk, xl) indicates the distance between the word Vk and feature vector xl . Then, after normalization events of visual words with L1 norm frequency vector image X displayed as HX = [h1x h2x. . . hkx] [1]. In addition to the strategy of nearest neighbor (NN) employed in this research, other techniques such as soft assign strategy [6] and multiple assign strategy [1] are also studied
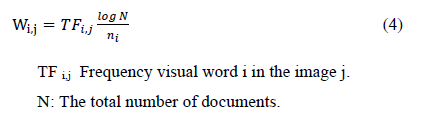
Weighting: Image retrieval method based on BOF is similar to the retrieval of the text. Weighting the textual words has a significant impact on data recovery. Weighting to a word provides information about the relevance of the word (visual word) in the document (picture). Weighting method checks the distribution and frequency of words in the document (image) and determines a numerical weight for the word. This weight means grade and credibility of a word in different documents. Also the weights are dependent on the frequency of occurrence of a word in the document and the frequency of occurrence of a word in a particular document.In this paper we used TF * IDF weighting method. It is as follows
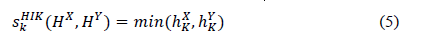
Measure of similarity:To measure of similarity between the histogram of query image and database images usually HIK and soft L1 and JSD [1] is suggested. Here we provide sharing core measurement that have excellent results in image retrieval and is calculated as follows
اختصاص ویژگی ها به کلمات تصویری : در این بخش نحوه اختصاص ویژگی ها به کلمات تصویری را توضیح می دهیم. 𝑥𝑙 یک بردار ویژگی را نشان می دهد که به نزدیکترین کلمه در فرهنگ لغت Vk اختصاص داده شده است. بنابراین تصویر X توسط ویژگی های محلی {(xl ، al)} نشان داده می شود. مقدار al به شرح زیر محاسبه می شود:
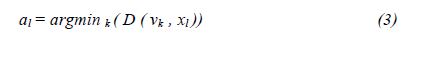
جایی که D (vk ، xl) فاصله بین کلمه Vk و بردار ویژگی xl را نشان می دهد. سپس ، پس از نرمال سازی رخدادهای کلمات تصویری با نرم تکرار L1 بردار تصویر X به صورت HX= [h1,h2,…hk] نمایش داده می شود. علاوه بر استراتژی نزدیکترین همسایه (NN) که در این تحقیق بکار رفته است ، تکنیکهای دیگری از جمله استراتژی اختصاص نرم [6] و استراتژی تخصیص چندگانه [1] نیز مورد مطالعه قرار گرفته است.
وزن دهی
روش بازیابی تصویر مبتنی بر BOF مشابه بازیابی متن است. توزین کلمات متنی تأثیر قابل توجهی در بازیابی اطلاعات دارد. توزین یک کلمه , اطلاعاتی راجع به ارتباط کلمه (کلمه تصویری) در سند فراهم می کند (تصویر). روش توزین توزیع و فراوانی کلمات در سند (تصویر) را بررسی می کند و یک وزن عددی برای کلمه تعیین می کند. این وزن به معنای درجه و اعتبار یک کلمه در اسناد مختلف است. همچنین وزن ها به دفعات وقوع یک کلمه در سند و تعداد دفعات وقوع یک کلمه در یک سند خاص بستگی دارد.در این مقاله از روش توزین TF * IDF استفاده شده است. به شرح زیر است
اندازه گیری شباهت: برای اندازه گیری تشابه بین هیستوگرام تصویر پرس و جو و تصاویر پایگاه داده معمولاً HIK وL1 و JSD [1] پیشنهاد می شود. در اینجا ما اندازه گیری هسته مشترک را ارائه می دهیم که نتایج بسیار خوبی در بازیابی تصویر دارد و به شرح زیر محاسبه می شود.
THE EXPERIMENTS
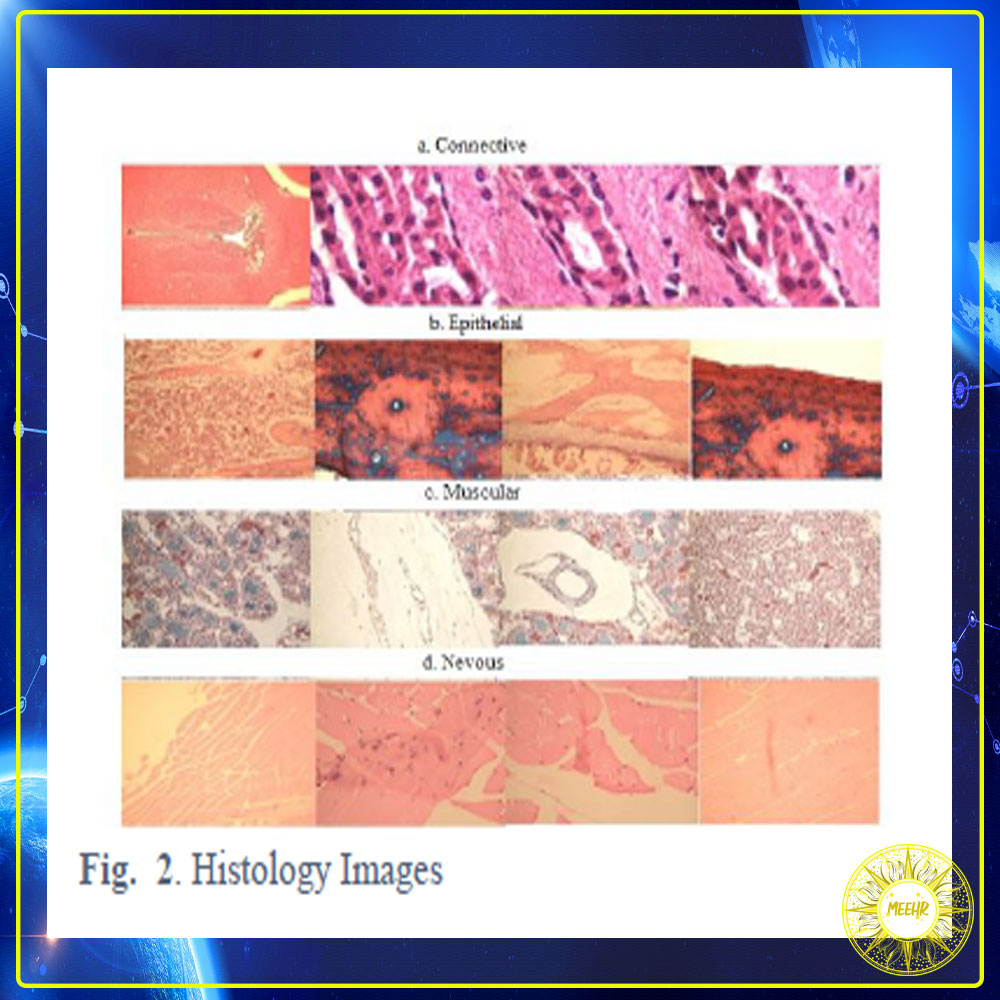
In order to evaluate the image retrieval performance, we used a set of standard histopathology images. This collection consists of images acquired from various body organs that are representative of the four basic tissues. This dataset contains 2828 images that are labeled in four different categories shown in fig. 2. The main components of this data set are:
-484 connective tissue images.
-804 mucosal tissues images.
-514 muscle tissue images.
-1026 nerve tissue images.
In our experiments images were divided into training and testing categories. 80 percent of total images were randomly selected for training and the remaining images were assigned for testing. To test the precision of the retrieval, we selected 5 images randomly from each category and evaluated them. Finally, the average of the collected results were considered as the final result
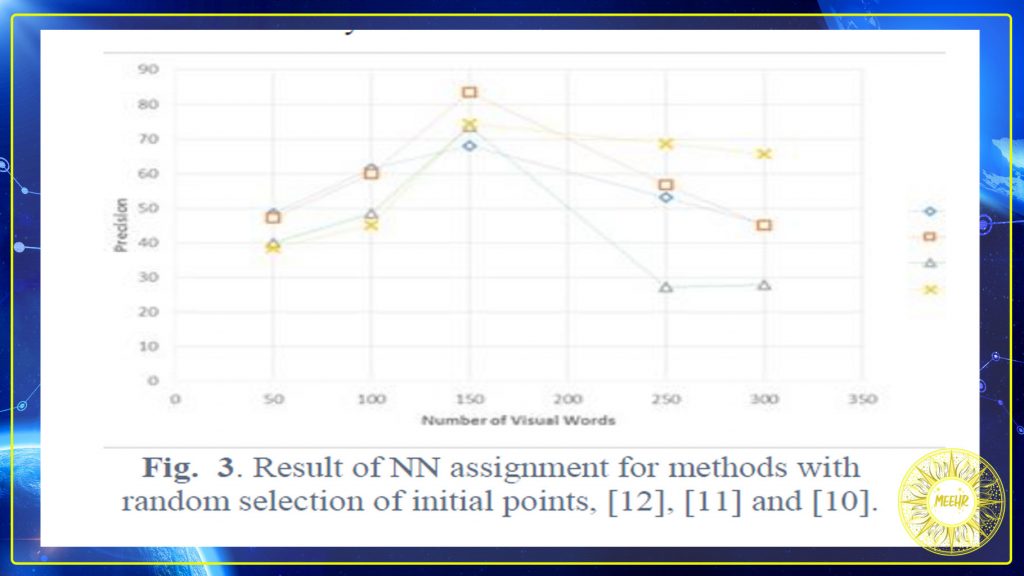
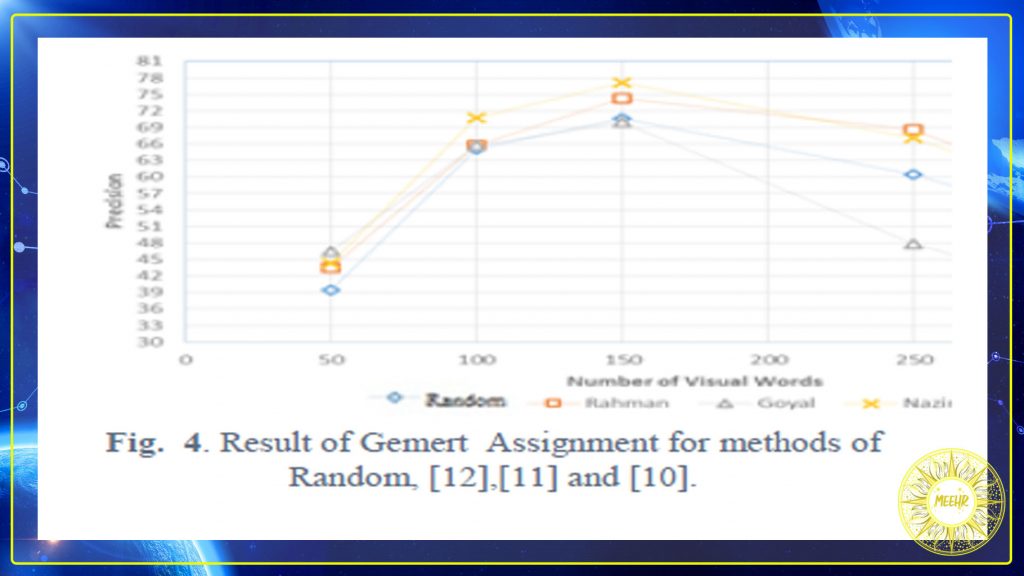
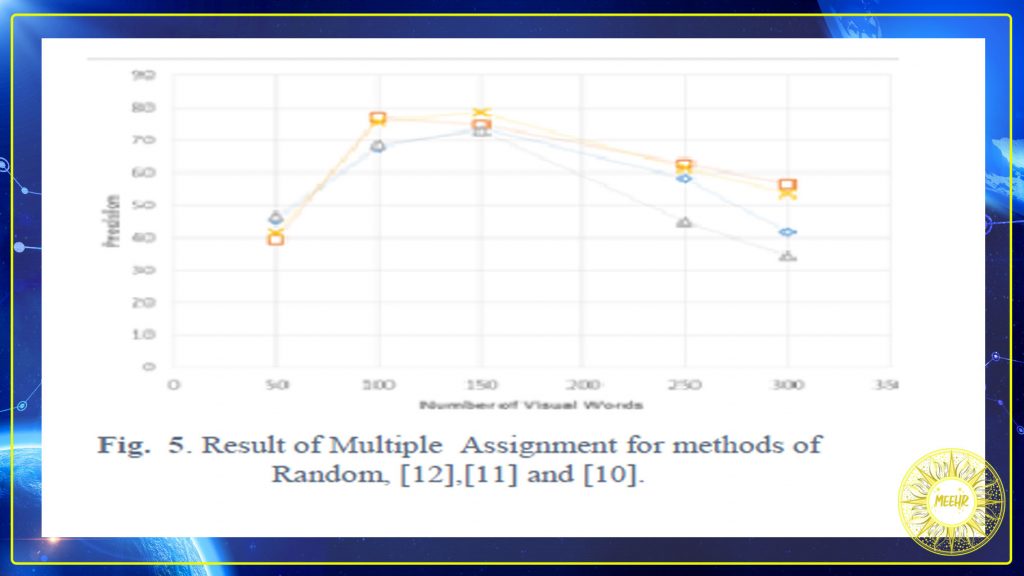
In this research, we conducted three experiments to evaluate the performance of the proposed method. In each experiments all methods of visual words including Random, Nazeer, Rahman,and Goyal were used. Each time the methods of assigning tuples to clusters have been changed including NN assign, soft assign (Gemert) and multiple assign (Multiple) that were used in first, second and third experiment respectively. In our first experiment, the tuples were assigned by soft method 48(Gemert), Rahman and Random methods had highest and lowest precision, respectively (Fig. 3). In the second experiment, Nazeer had maximum accuracy and Goyal had the poor accuracy (Fig. 4). In the third experiment, the multiple assignment method, the method of Nazeer, had the most accuracy and Goyal had the lowest accuracy (Fig. 5). Consequently, it can be seen in experiments that used non-random selection centers have higher accuracy than random methods. Assigning features also effect on retrieved accuracy.
تجربیات
به منظور ارزیابی عملکرد بازیابی تصویر ، ما از مجموعه ای از تصاویر استاندارد هیستوپاتولوژی استفاده کردیم. این مجموعه شامل تصاویر بدست آمده از اندام های مختلف بدن است که نمایانگر چهار بافت اساسی هستند. این مجموعه داده شامل 2828 تصویر است که در چهار دسته مختلف نشان داده شده در شکل برچسب گذاری شده است. 2. اجزای اصلی این مجموعه داده عبارتند از:
-484 عکس بافت همبند.
-804 تصاویر بافت مخاطی.
-514 تصویر بافت عضلانی.
-1026 تصویر بافت عصبی.
در آزمایشات ما تصاویر به دو دسته آموزش و آزمایش تقسیم شدند. 80 درصد از کل تصاویر به طور تصادفی برای آموزش و تصاویر باقیمانده برای آزمایش انتخاب شدند. برای تست دقت بازیابی ، از هر گروه 5 تصویر را به طور تصادفی انتخاب کردیم و آنها را ارزیابی کردیم. سرانجام ، میانگین نتایج جمع آوری شده به عنوان نتیجه نهایی در نظر گرفته شد.
در این تحقیق ، ما سه آزمایش برای ارزیابی عملکرد روش پیشنهادی انجام داده ایم. در هر آزمایش از همه روش های کلمات تصویری از جمله Random ، Nazeer ، رحمان و Goyal استفاده شد. هر بار که روش های اختصاص دادن تاپل به خوشه ها از جمله اختصاص NN ، تخصیص نرم (Gemert) و تخصیص چندگانه (Multiple) تغییر یافته است که به ترتیب در آزمایش اول ، دوم و سوم استفاده شده است. در اولین آزمایش ما ، تاپل ها به روش نرم 48 (Gemert) اختصاص داده شدند ، به ترتیب رحمان و Random دارای بالاترین و کمترین دقت بودند (شکل 3). در آزمایش دوم ، نازیر از حداکثر دقت و گویال از دقت ضعیف برخوردار بودند (شکل 4). در آزمایش سوم ، روش تخصیص چندگانه ، روش Nazeer ، بیشترین دقت و Goyal کمترین دقت را داشتند (شکل 5). در نتیجه ، در آزمایشات مشاهده می شود که مراکز انتخاب غیر تصادفی دارای دقت بالاتری نسبت به روشهای تصادفی هستند. اختصاص ویژگی ها نیز بر دقت بازیابی تأثیر می گذارد.
CONCLUSION
Image retrieval based on bag-of-visual words approach is one of the state-of-the-art methods for image retrieval that uses K-means clustering to create visual words; but the basis of this clustering algorithm is selecting initial cluster centers randomly. Therefore, each time the clustering algorithm is applied on same data, different clustering results will be obtained leading to poor performance results.
In our new method, we performed retrieval of medical images by estimating optimal selection of initial centers in K-means clustering which employed three different methods to select the initial cluster centers and also three methods to assign data points to the visual words. As we have shown non-random methods of selection of initial centers have superior performance in compare to random methods.
نتیجه
بازیابی تصویر بر اساس رویکرد کلمات بصری ، یکی از پیشرفته ترین روش های بازیابی تصویر است که از خوشه بندی K-means برای ایجاد کلمات تصویری استفاده می کند. اما اساس این الگوریتم خوشه بندی انتخاب مراکز خوشه ای اولیه به صورت تصادفی است. بنابراین ، هر بار که الگوریتم خوشه بندی روی داده های مشابه اعمال می شود ، نتایج مختلف خوشه بندی به دست می آید که منجر به نتایج عملکرد ضعیف می شود.
در روش جدید ما ، بازیابی تصاویر پزشکی را با تخمین انتخاب بهینه مراکز اولیه در خوشه بندی K-means انجام دادیم که از سه روش مختلف برای انتخاب مراکز خوشه اولیه و همچنین سه روش برای تخصیص نقاط داده به کلمات تصویری استفاده کرده است. همانطور که نشان داده ایم روشهای غیر تصادفی انتخاب مراکز اولیه در مقایسه با روشهای تصادفی عملکرد بهتری دارند
دانلود مقاله اصلی از لینک زیر